Learn about WorkInTexas.com's current job supply data. Discover what careers and industries are most desirable.
Job Seeker Supply Pie Charts & Data Tables
This data reflects the WorkInTexas.com job seeker supply as of April 17, 2025.
While these snapshots represent our available talent pool, exact counts vary daily with employment fluctuations.
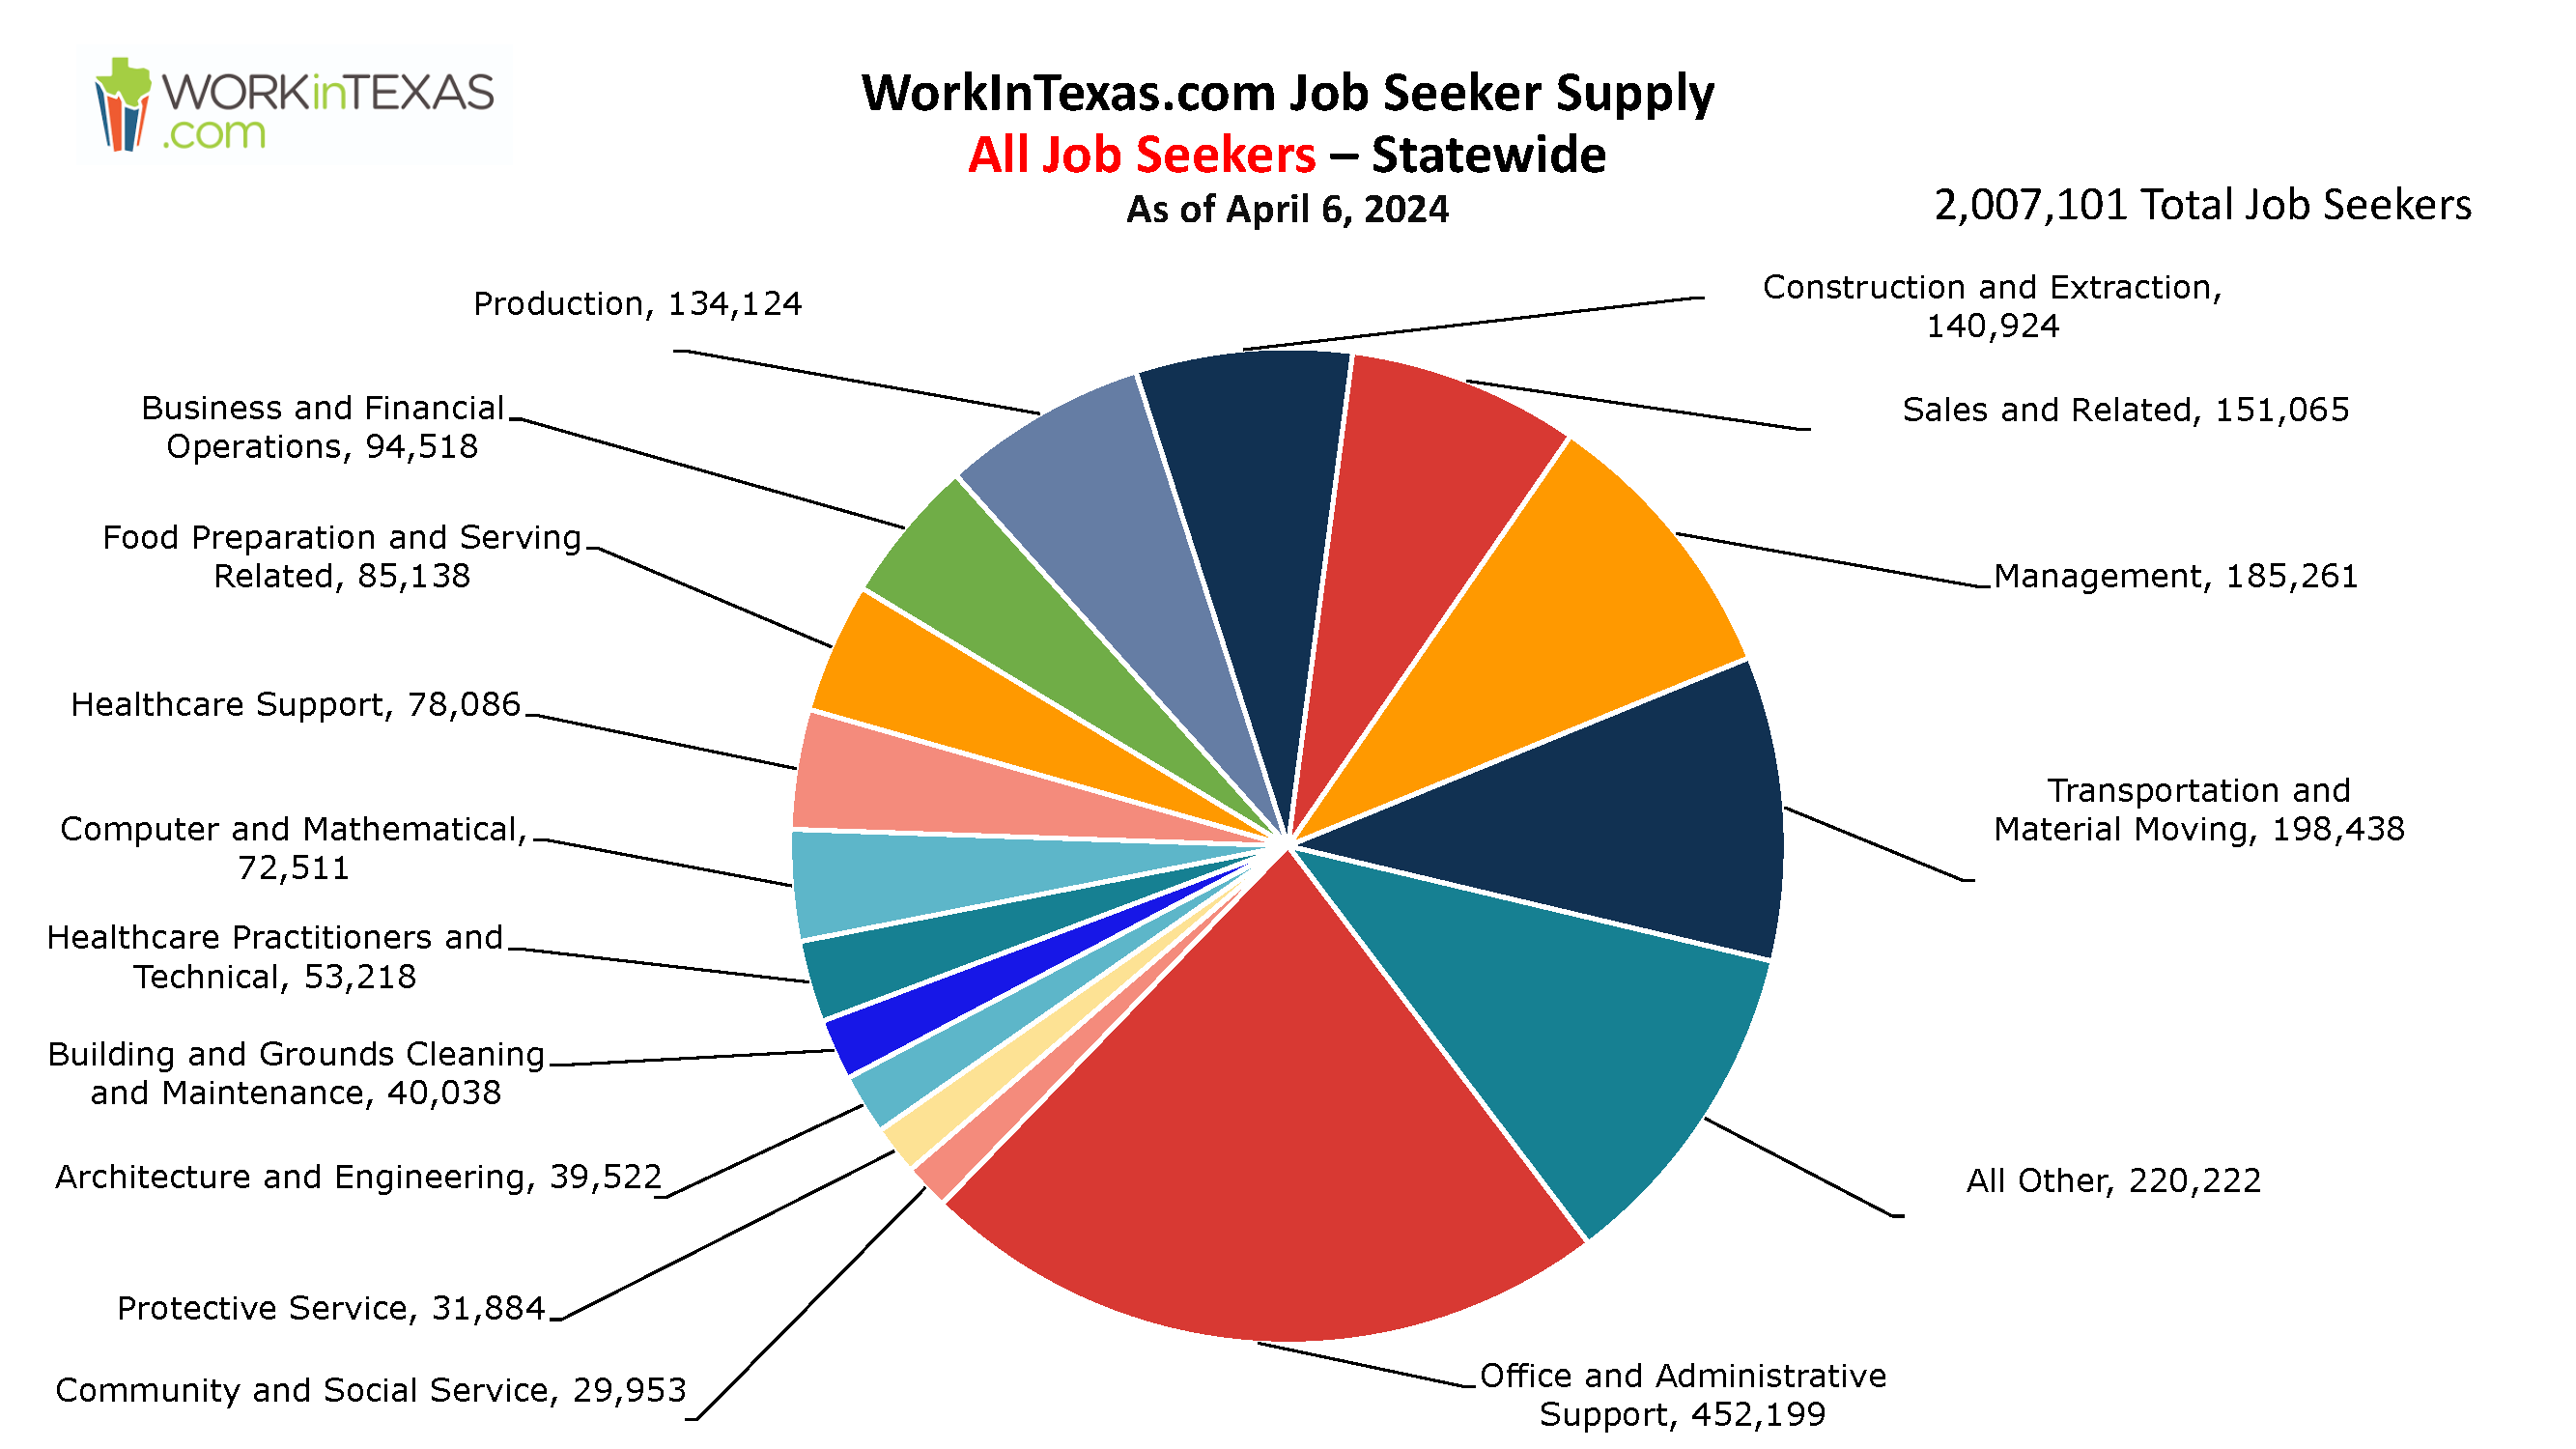
All Occupational Groups - Job Seekers 2,190,039 (Statewide)
| Occupational Category | Count |
|---|---|
| Office and Administrative Support | 488,087 |
| All Other | 238,869 |
| Transportation and Material Moving | 217,248 |
| Management | 205,899 |
| Sales and Related | 164,486 |
| Construction and Extraction | 152,184 |
| Production | 144,106 |
| Business and Financial Operations | 105,765 |
| Food Preparation and Serving Related | 91,043 |
| Healthcare Support | 85,658 |
| Computer and Mathematical | 84,024 |
| Healthcare Practitioners and Technical | 58,318 |
| Building and Grounds Cleaning and Maintenance | 43,712 |
| Architecture and Engineering | 43,086 |
| Protective Service | 34,982 |
| Community and Social Service | 32,572 |
| Total | 2,190,039 |
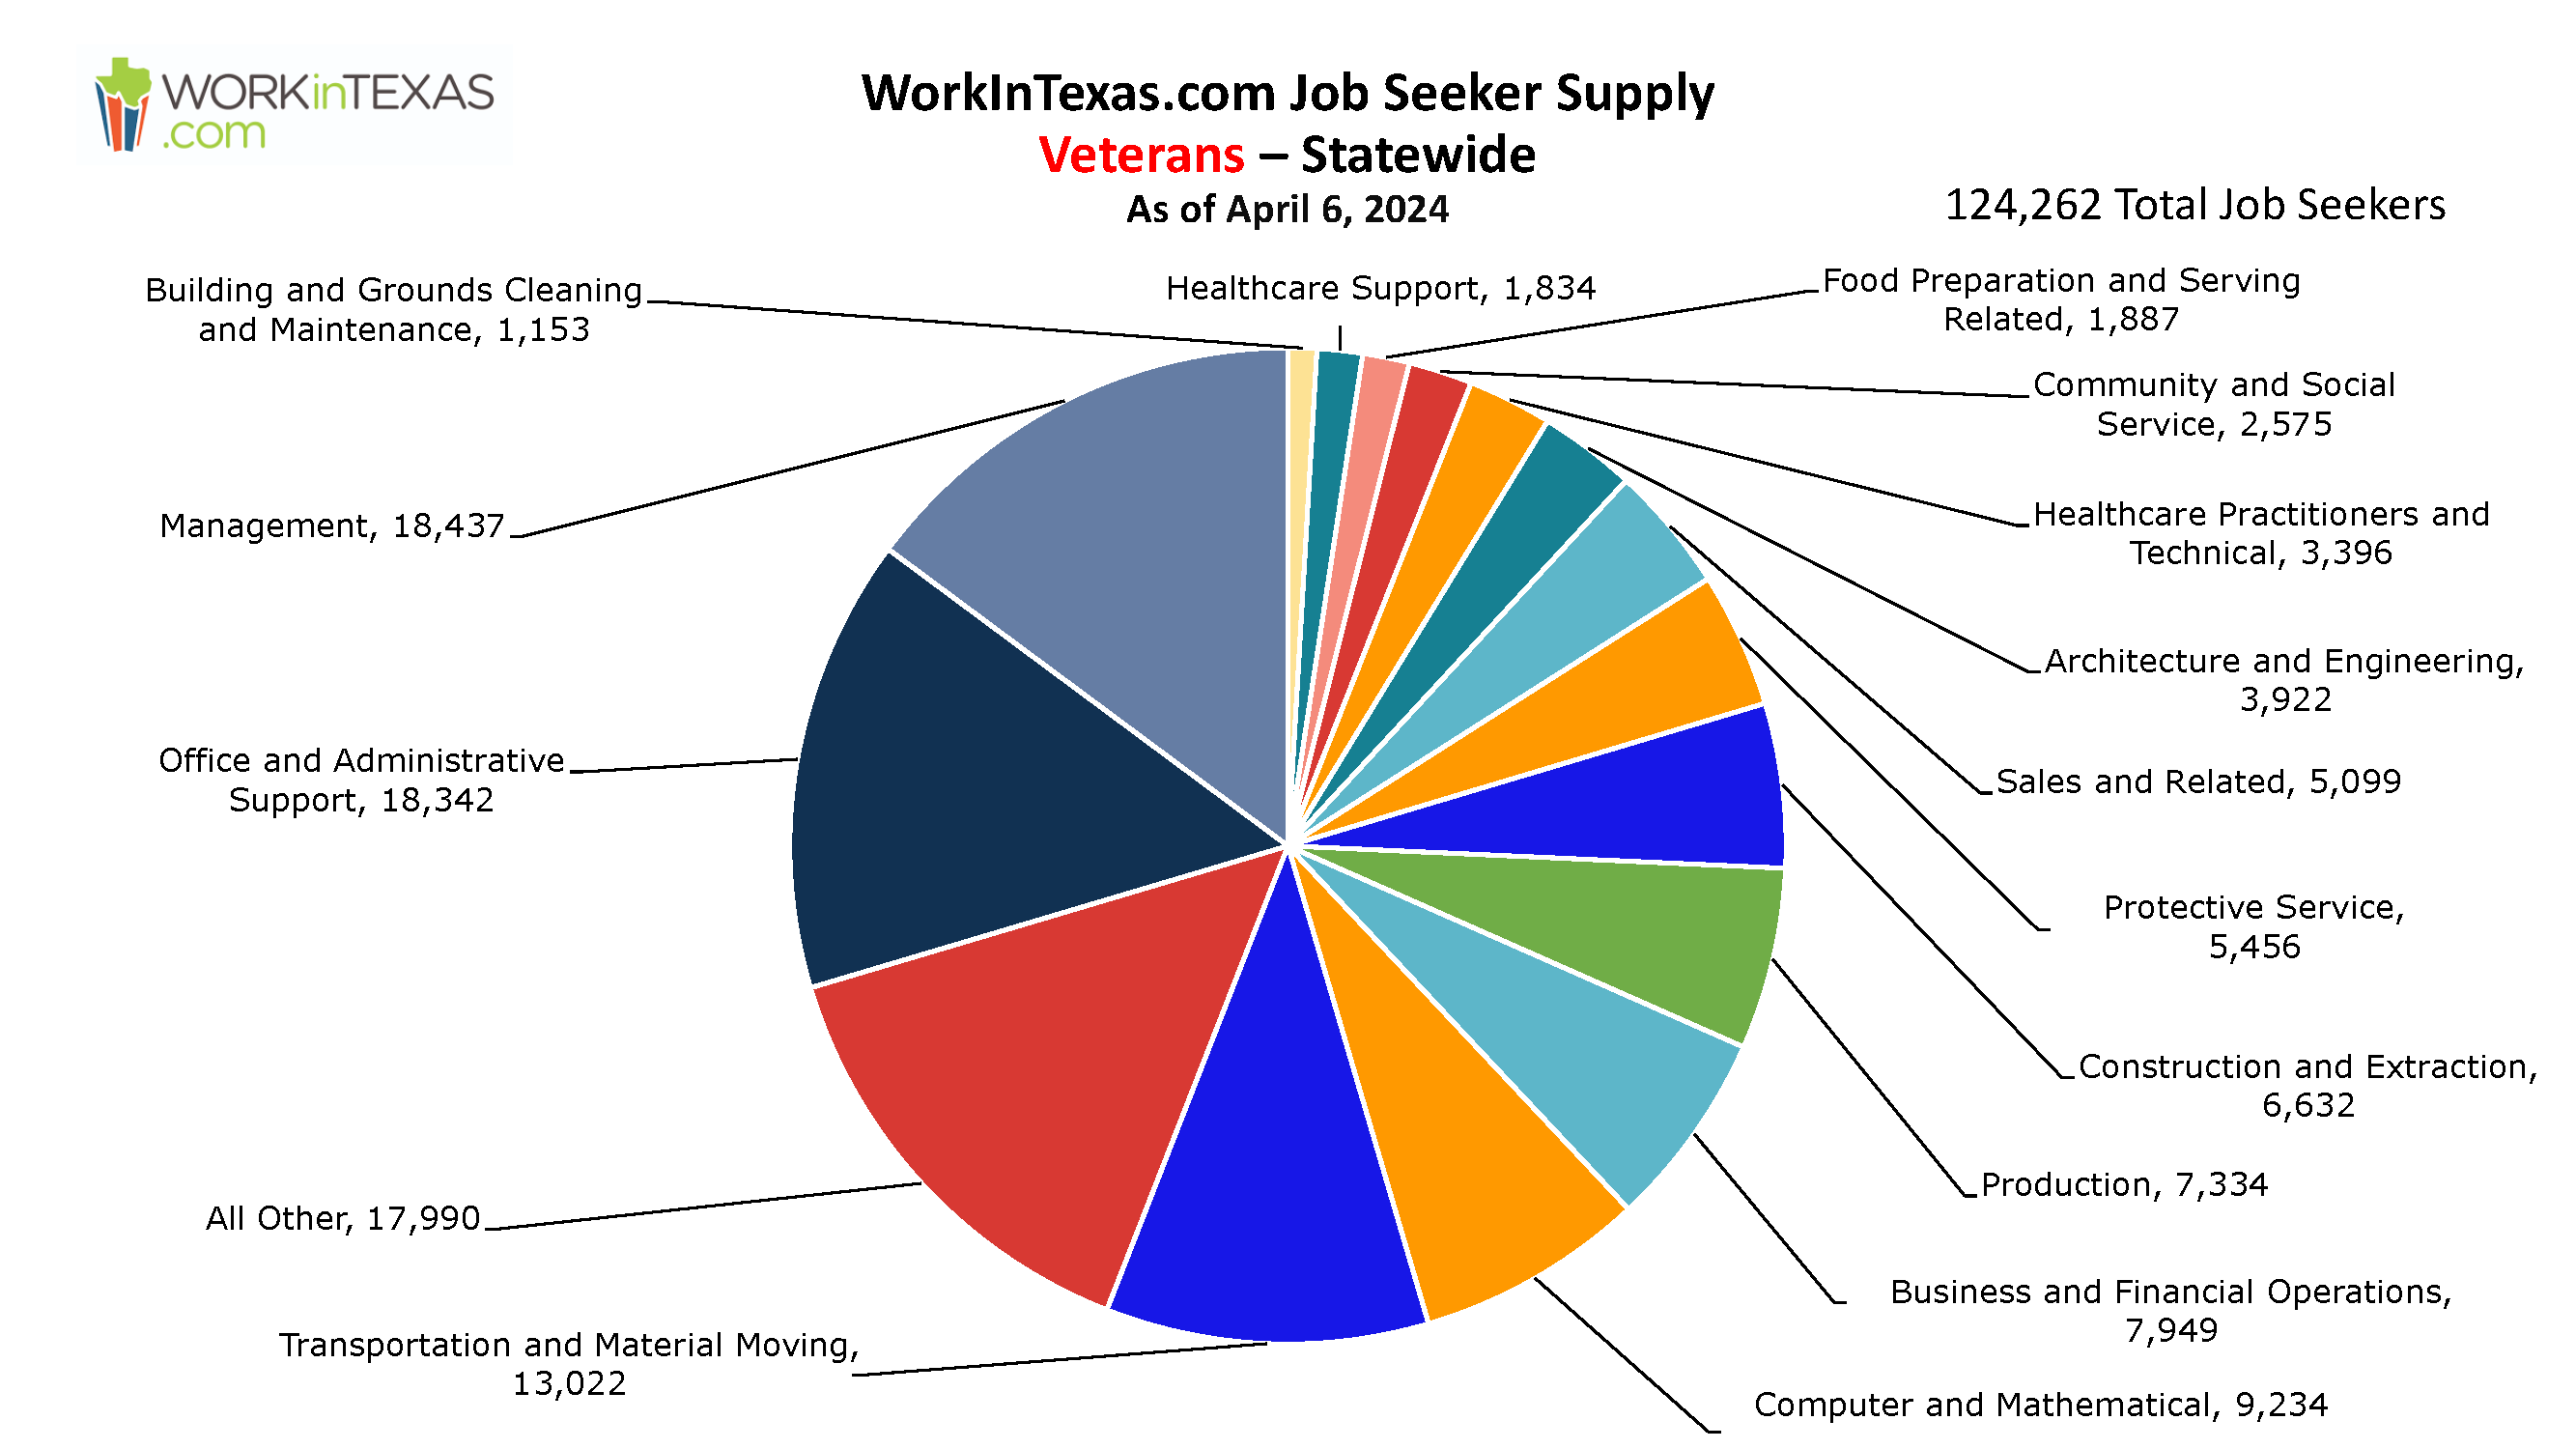
All Occupational Groups - Veterans 133,633 (Statewide)
| Occupational Category | Count |
|---|---|
| Management | 20,026 |
| Office and Administrative Support | 19,331 |
| All Other | 19,303 |
| Transportation and Material Moving | 13,976 |
| Computer and Mathematical | 10,418 |
| Business and Financial Operations | 8,737 |
| Production | 7,693 |
| Construction and Extraction | 7,027 |
| Protective Service | 5,930 |
| Sales and Related | 5,467 |
| Architecture and Engineering | 4,249 |
| Healthcare Practitioners and Technical | 3,677 |
| Community and Social Service | 2,654 |
| Healthcare Support | 1,984 |
| Food Preparation and Serving Related | 1,952 |
| Building and Grounds Cleaning and Maintenance | 1,209 |
| Total | 133,633 |
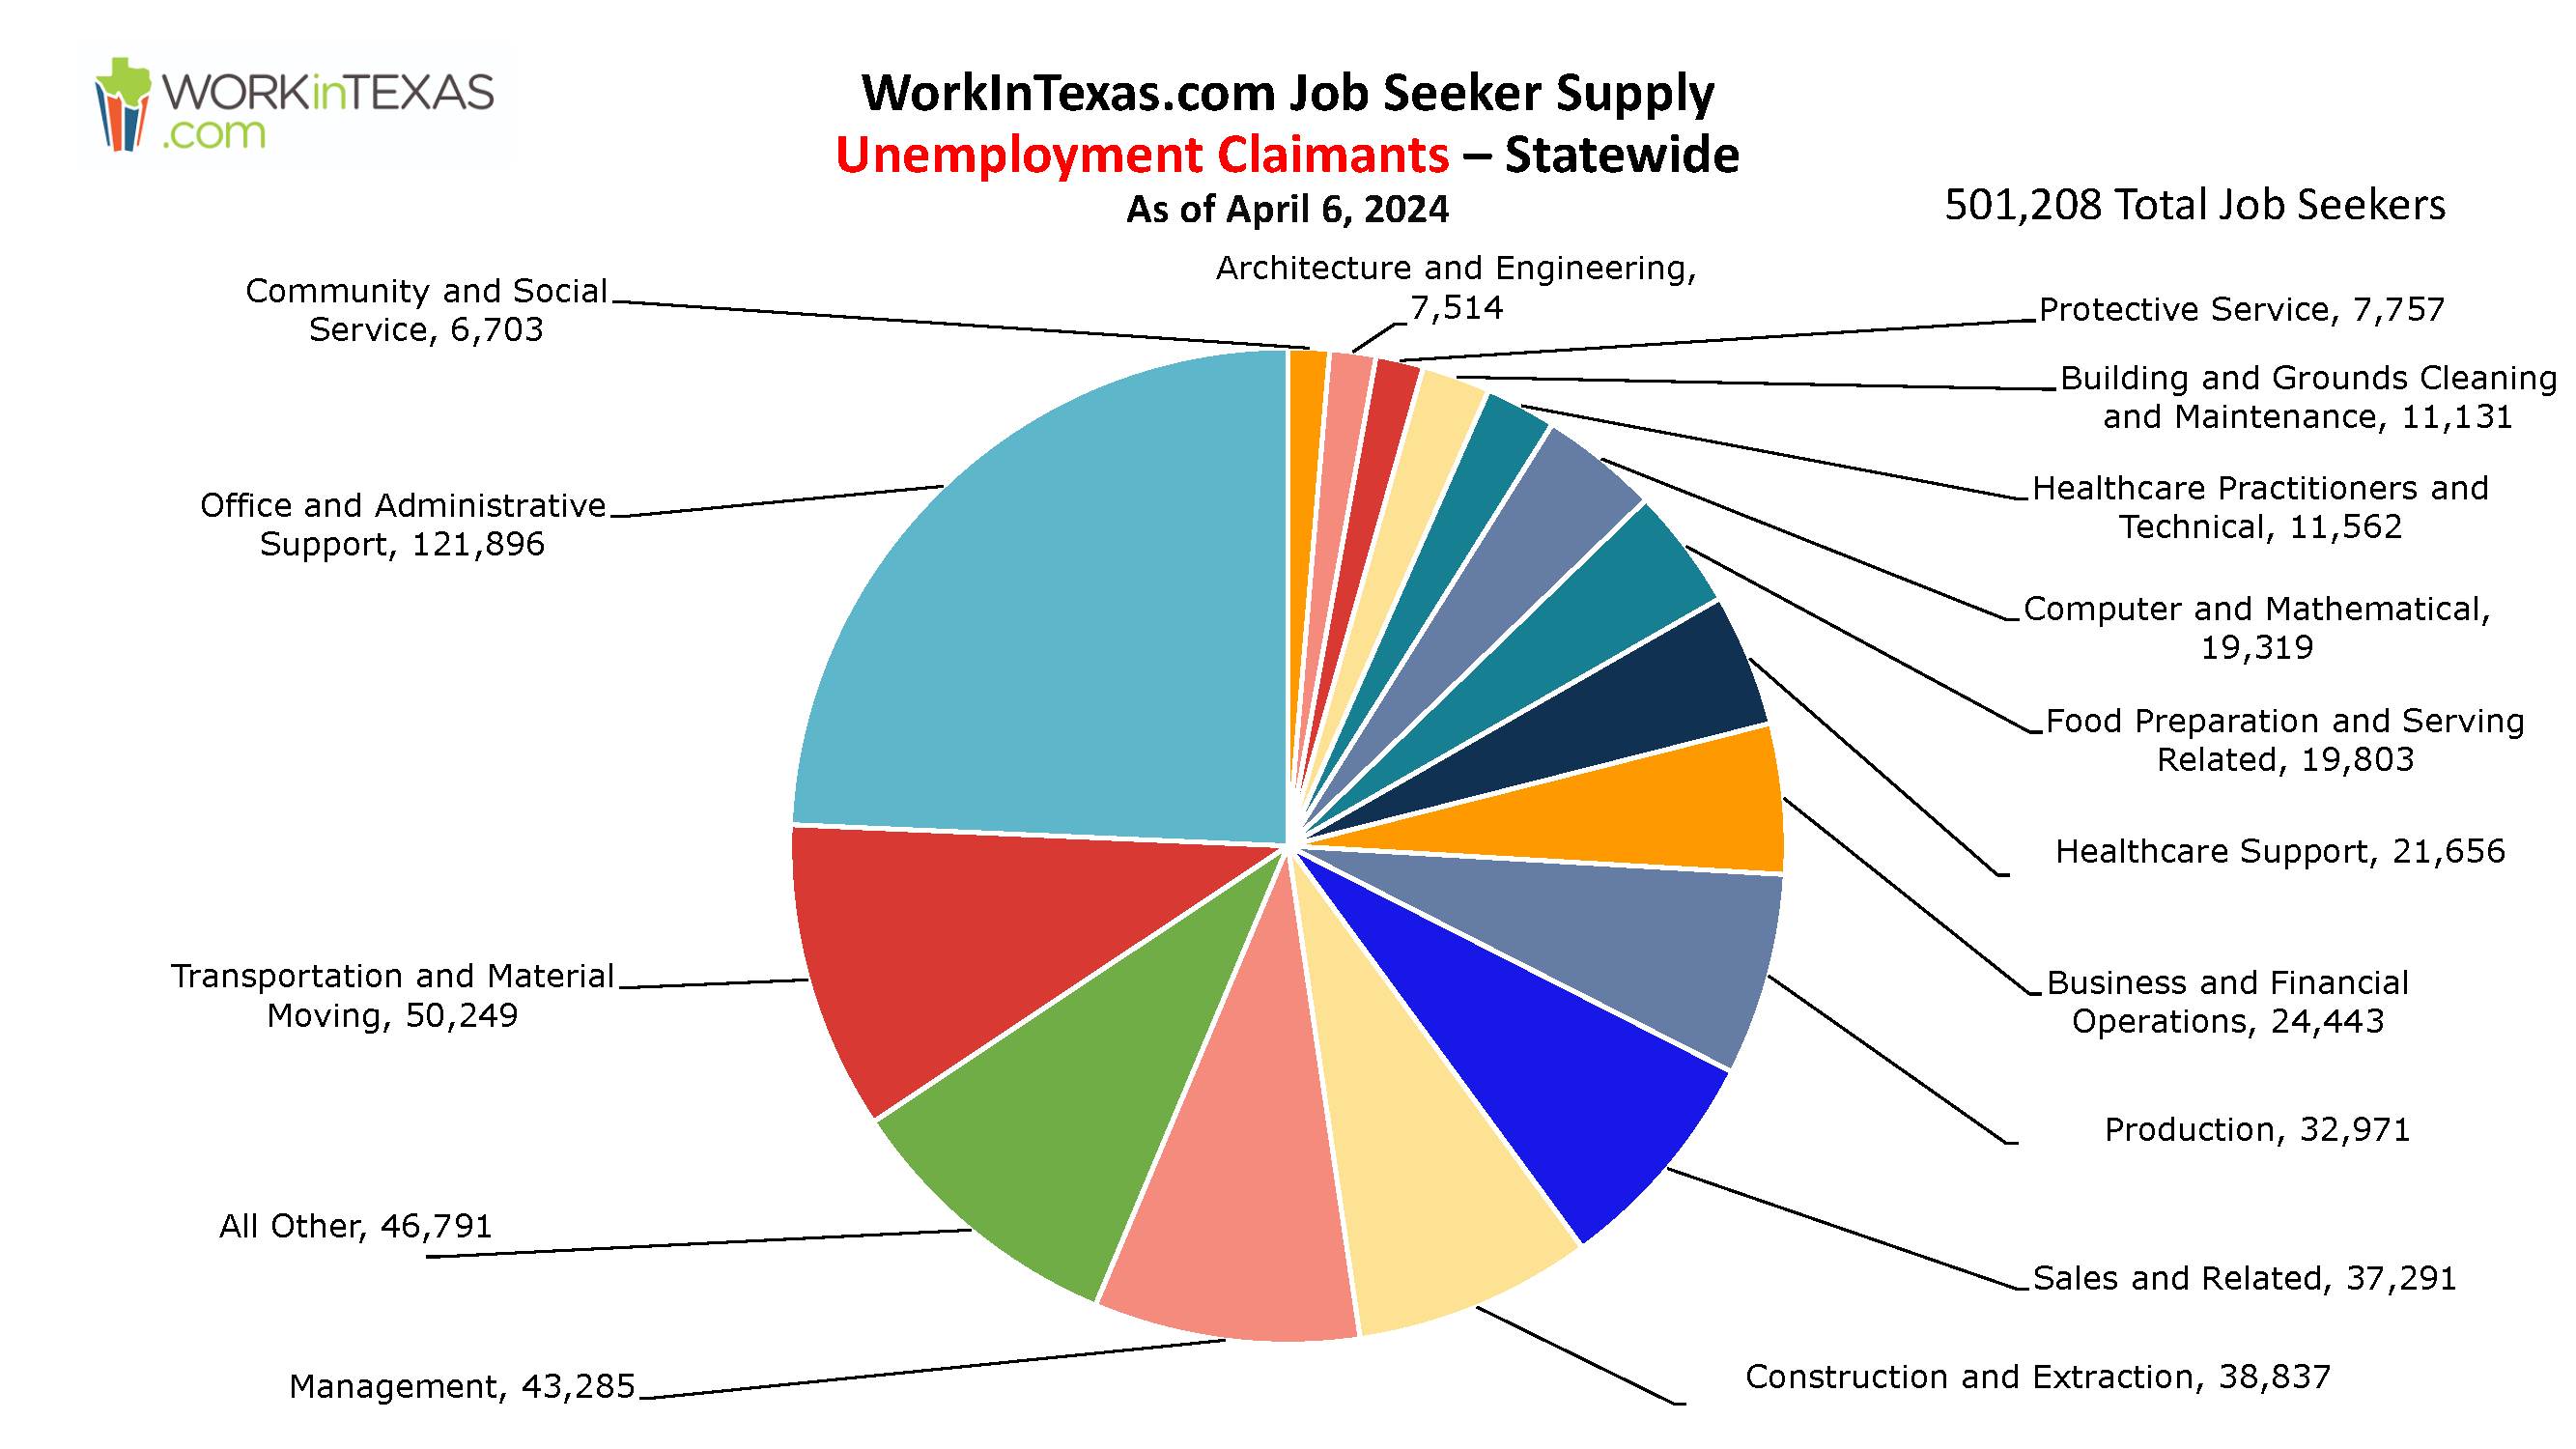
All Occupational Groups - Unemployment Claimants 493,128 (Statewide)
| Occupational Category | Count |
|---|---|
| Office and Administrative Support | 116,934 |
| Transportation and Material Moving | 50,243 |
| All Other | 47,078 |
| Management | 42,201 |
| Construction and Extraction | 38,149 |
| Sales and Related | 36,387 |
| Production | 32,511 |
| Business and Financial Operations | 22,858 |
| Healthcare Support | 21,824 |
| Food Preparation and Serving Related | 20,102 |
| Computer and Mathematical | 19,117 |
| Healthcare Practitioners and Technical | 11,375 |
| Building and Grounds Cleaning and Maintenance | 11,328 |
| Protective Service | 8,159 |
| Architecture and Engineering | 7,802 |
| Community and Social Service | 7,060 |
| Total | 493,128 |
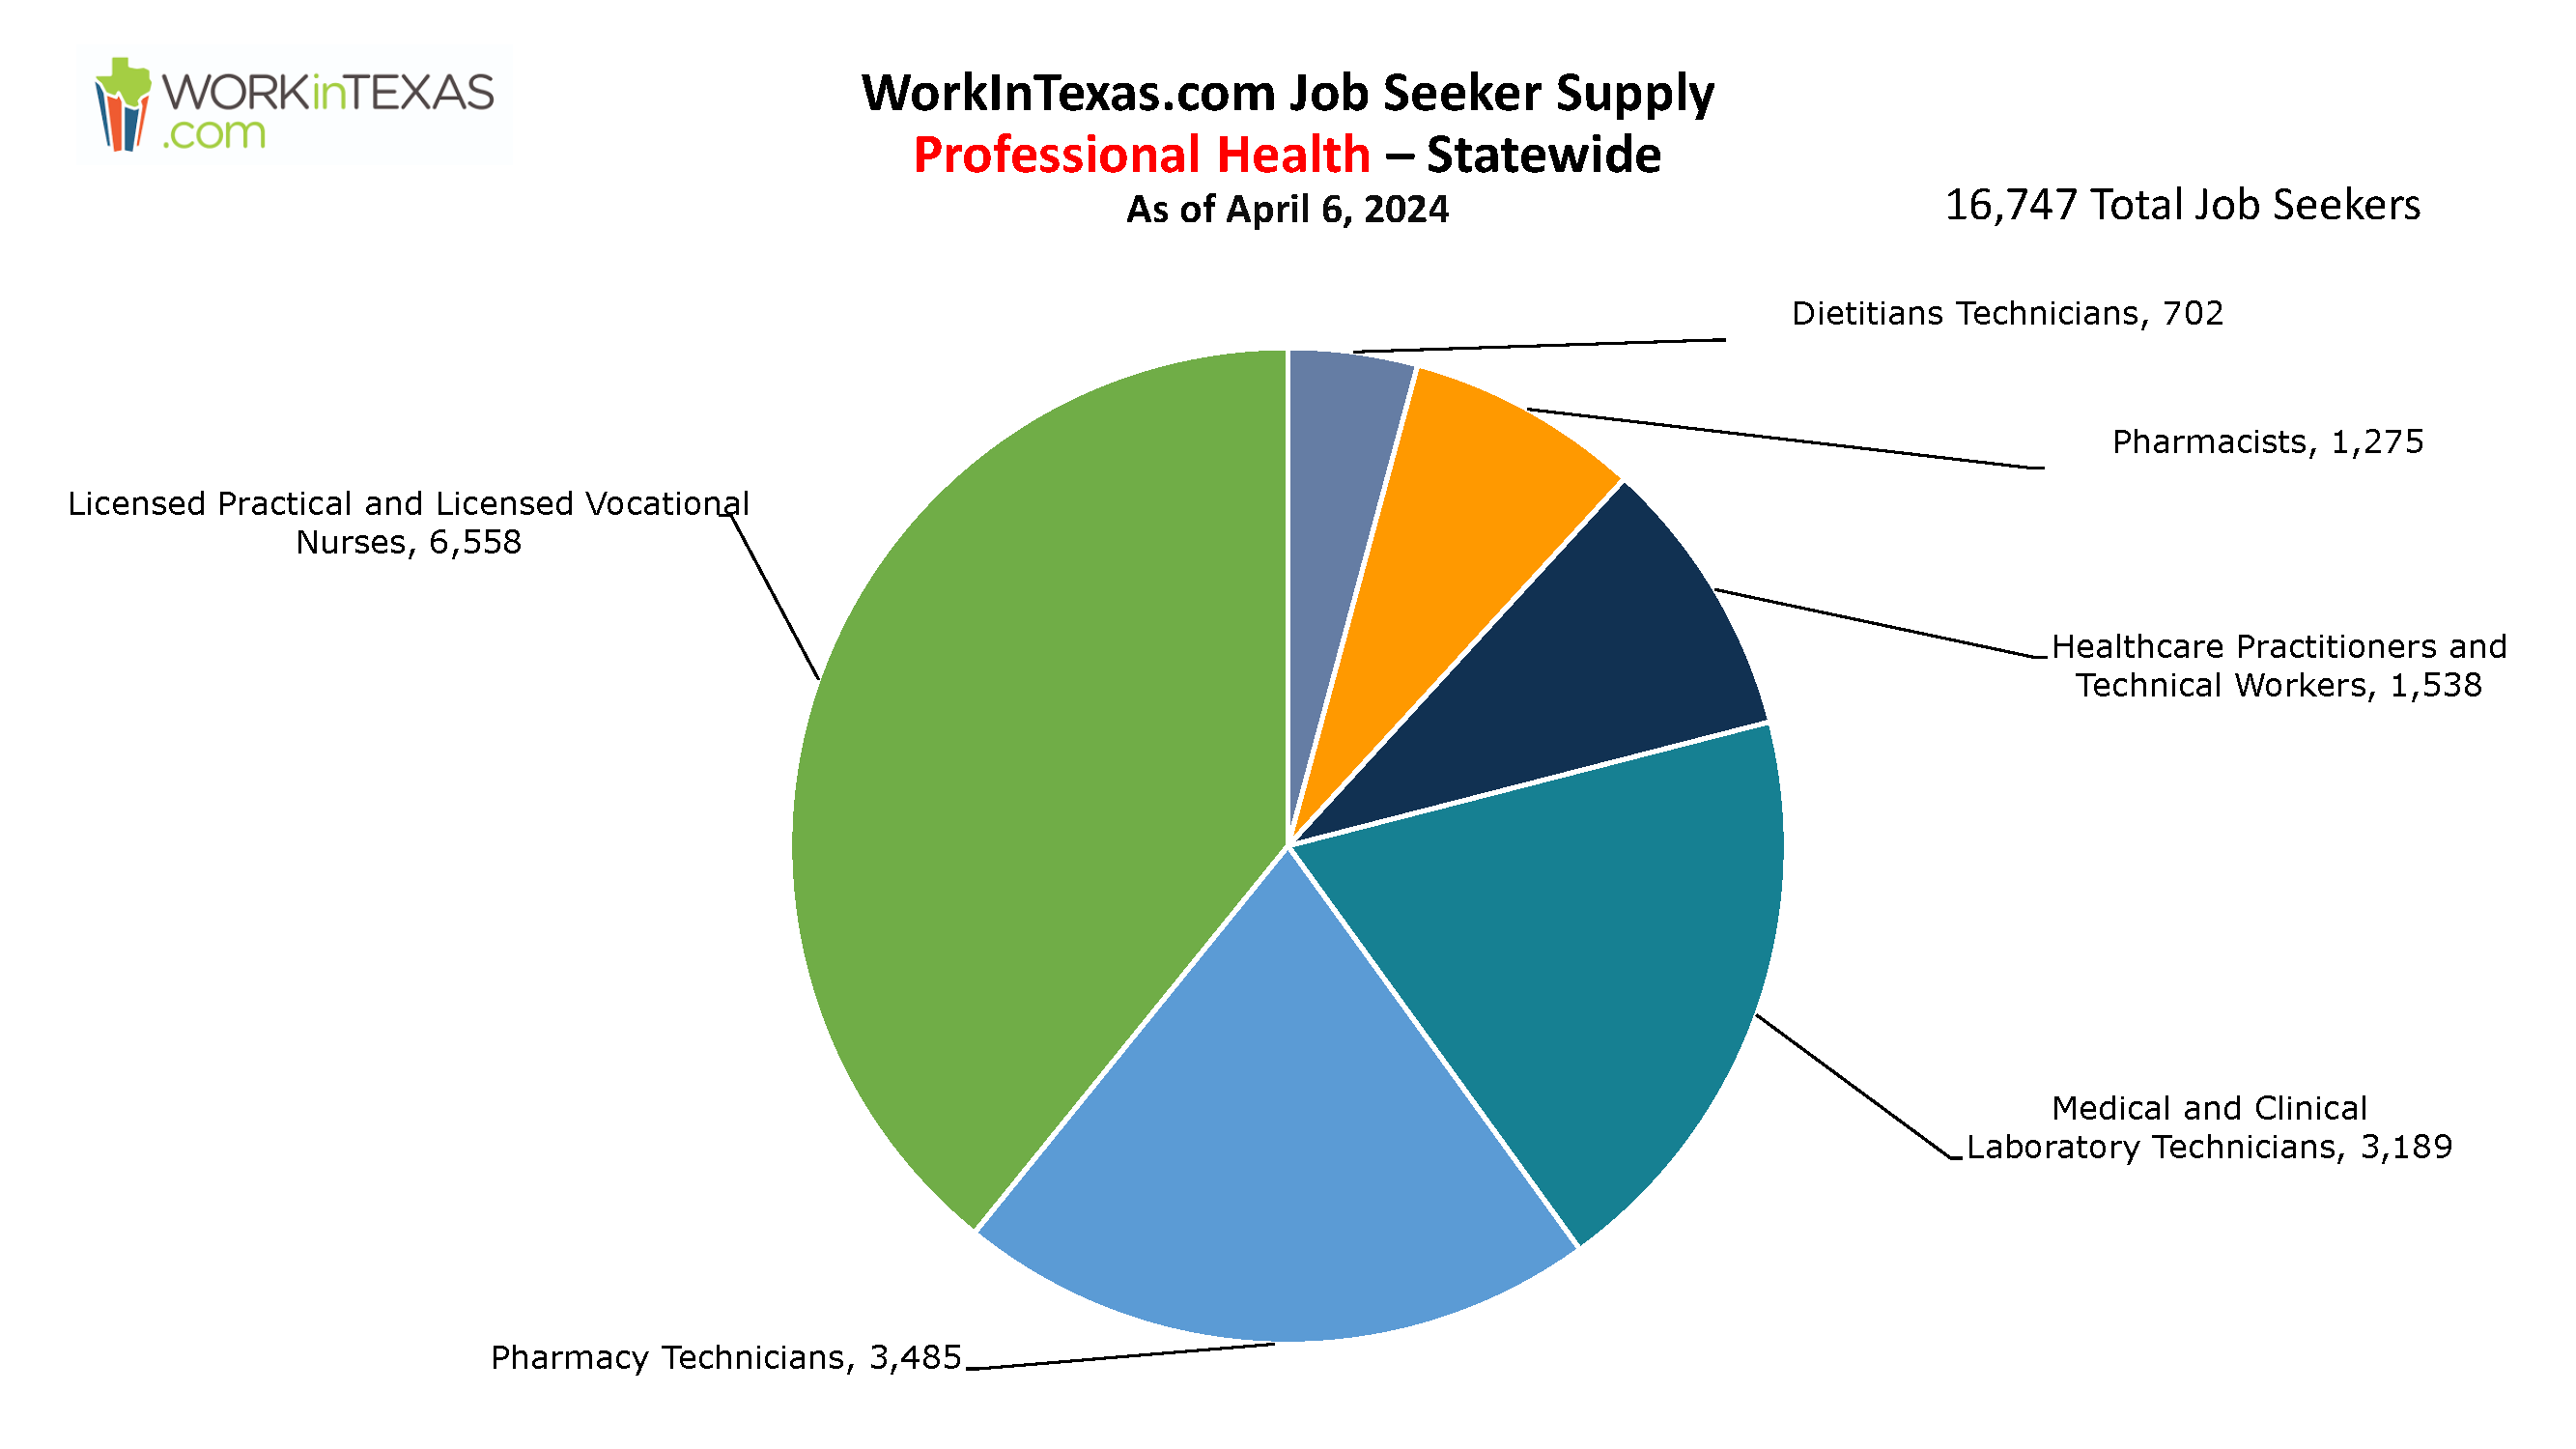
Professional Health Occupations 18,358 (Statewide)
| Occupational Category | Count |
|---|---|
| Licensed Practical and Licensed Vocational Nurses | 7,280 |
| Pharmacy Technicians | 3,899 |
| Medical and Clinical Laboratory Technicians | 3,429 |
| Healthcare Practitioners and Technical Workers | 1,630 |
| Pharmacists | 1,360 |
| Dietitians Technicians | 760 |
| Total | 18,358 |
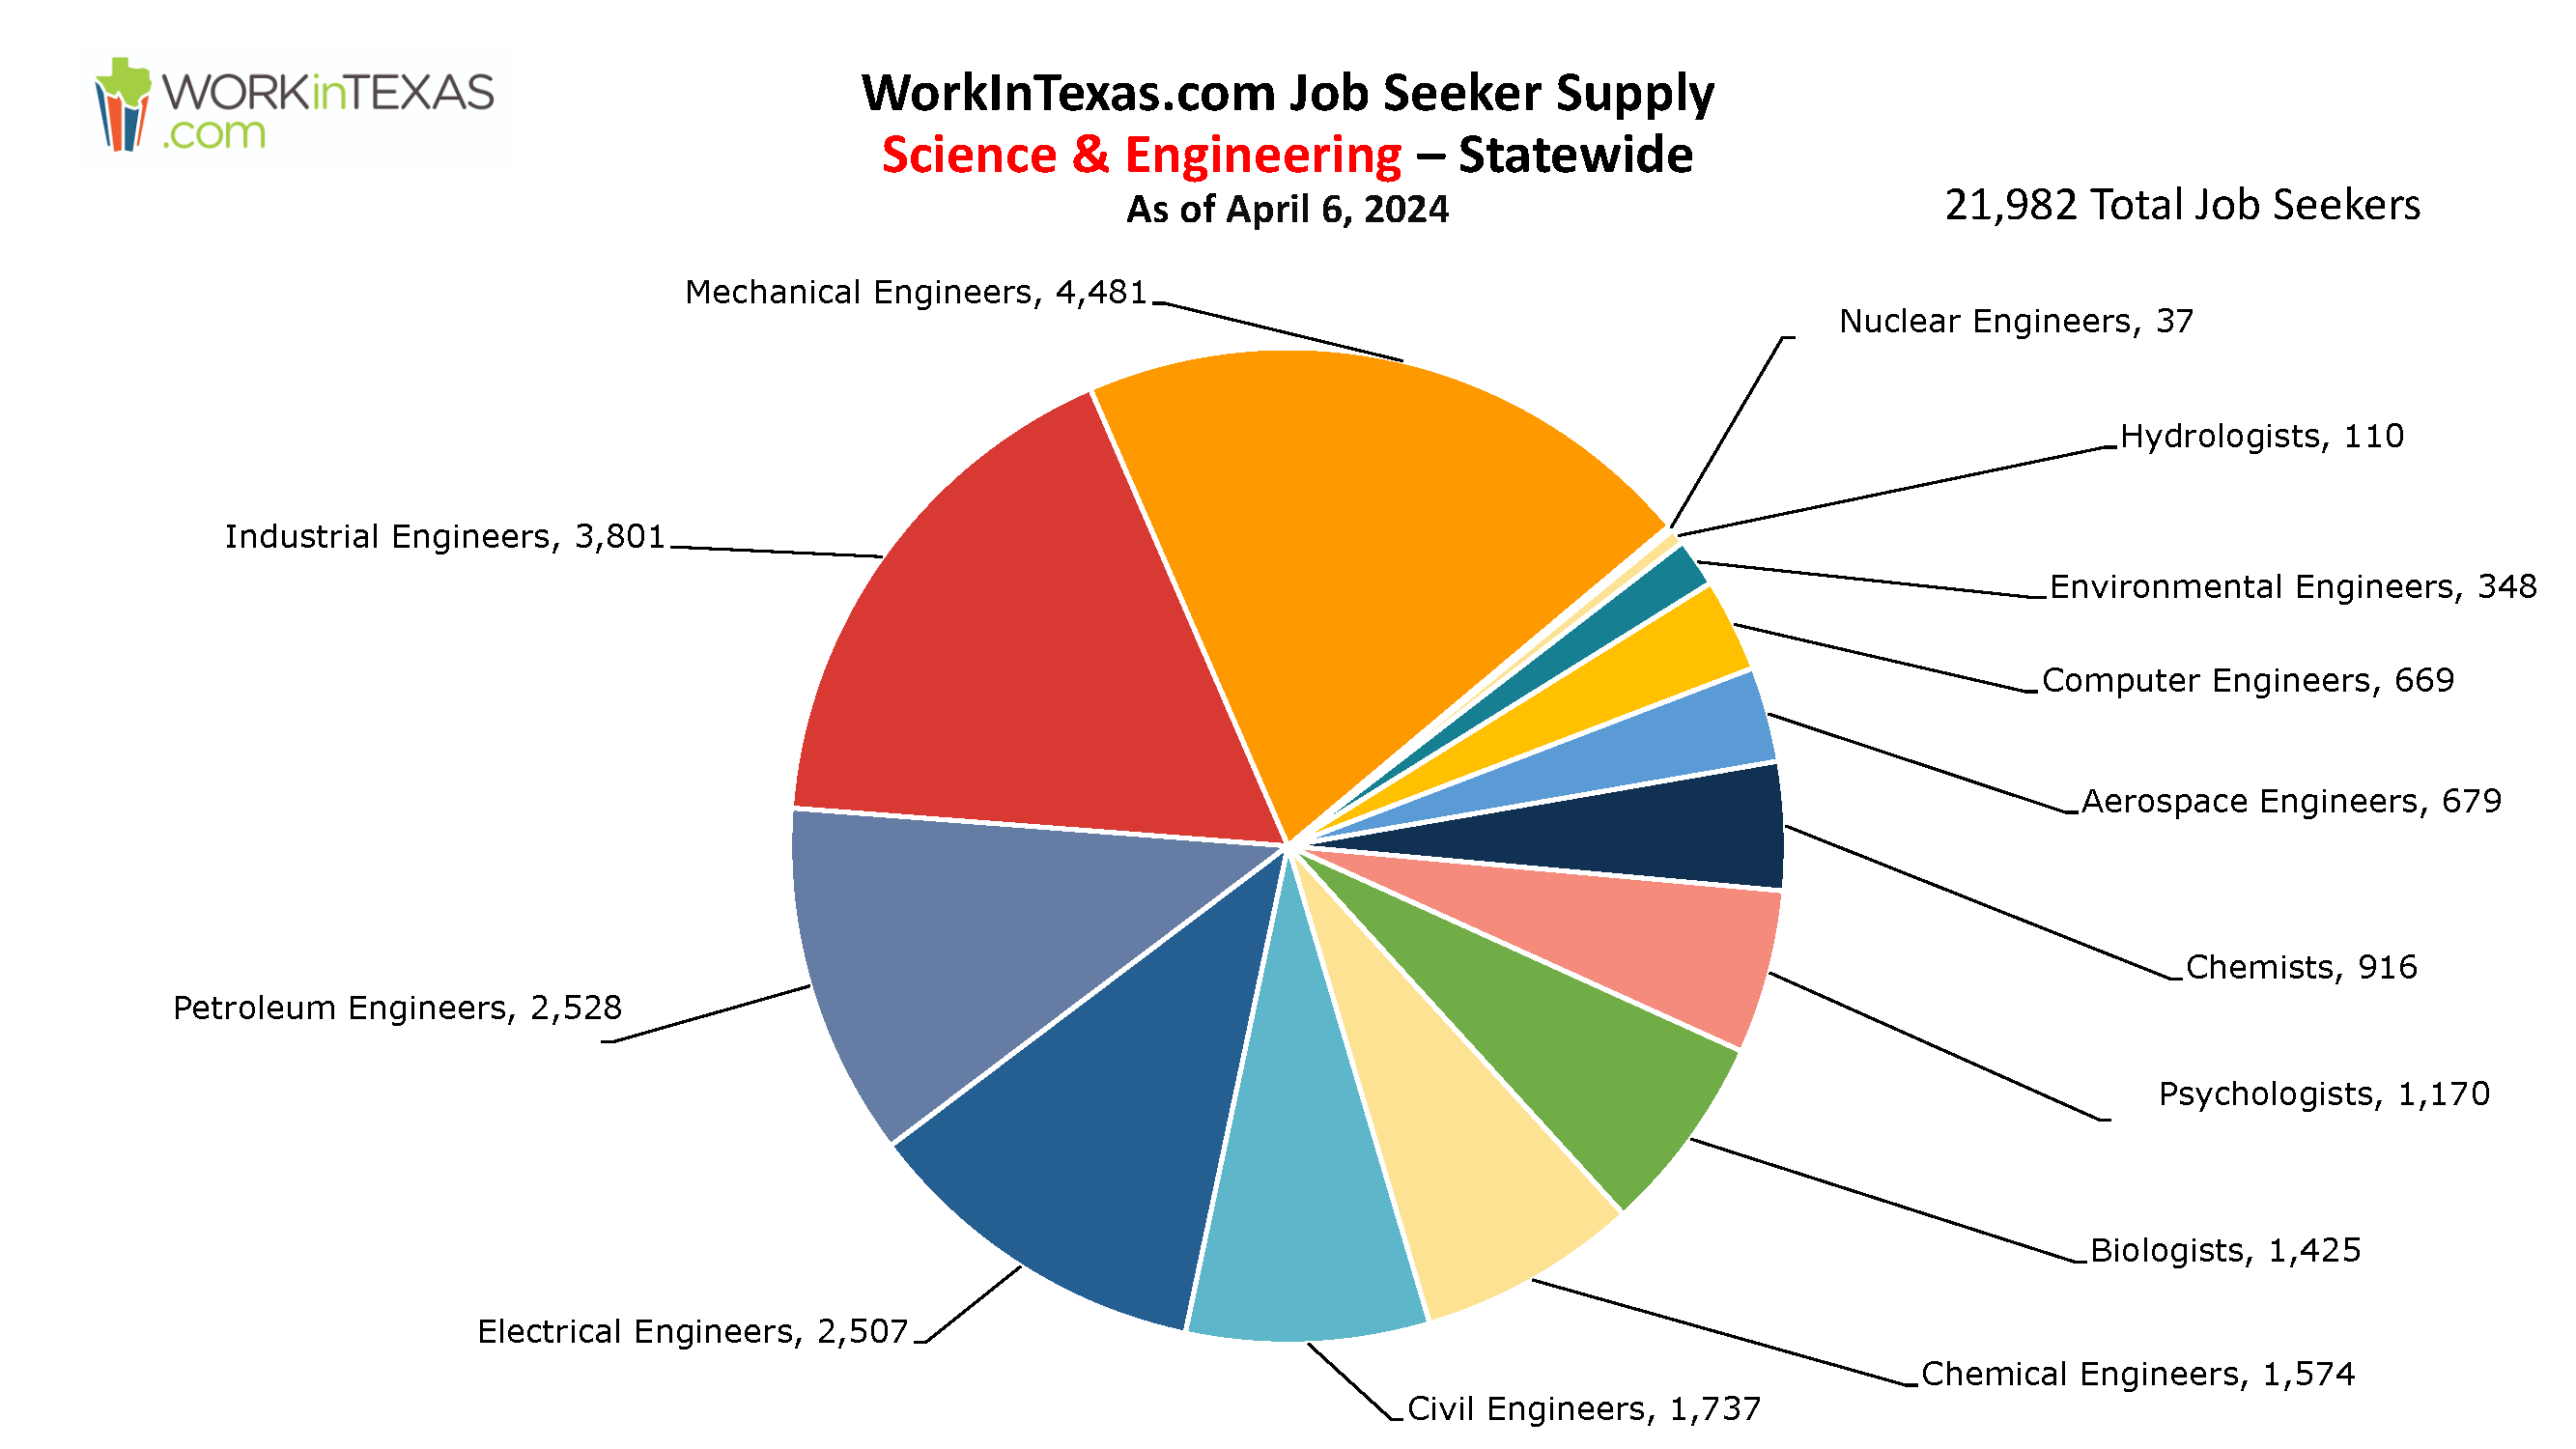
Science & Engineering Occupations 23,980 (Statewide)
| Occupational Category | Count |
|---|---|
| Mechanical Engineers | 4,934 |
| Industrial Engineers | 4,168 |
| Electrical Engineers | 2,795 |
| Petroleum Engineers | 2,651 |
| Civil Engineers | 1,881 |
| Chemical Engineers | 1,678 |
| Biologists | 1,589 |
| Psychologists | 1,266 |
| Chemists | 992 |
| Aerospace Engineers | 790 |
| Computer Engineers | 724 |
| Environmental Engineers | 356 |
| Hydrologists | 110 |
| Nuclear Engineers | 46 |
| Total | 23,980 |
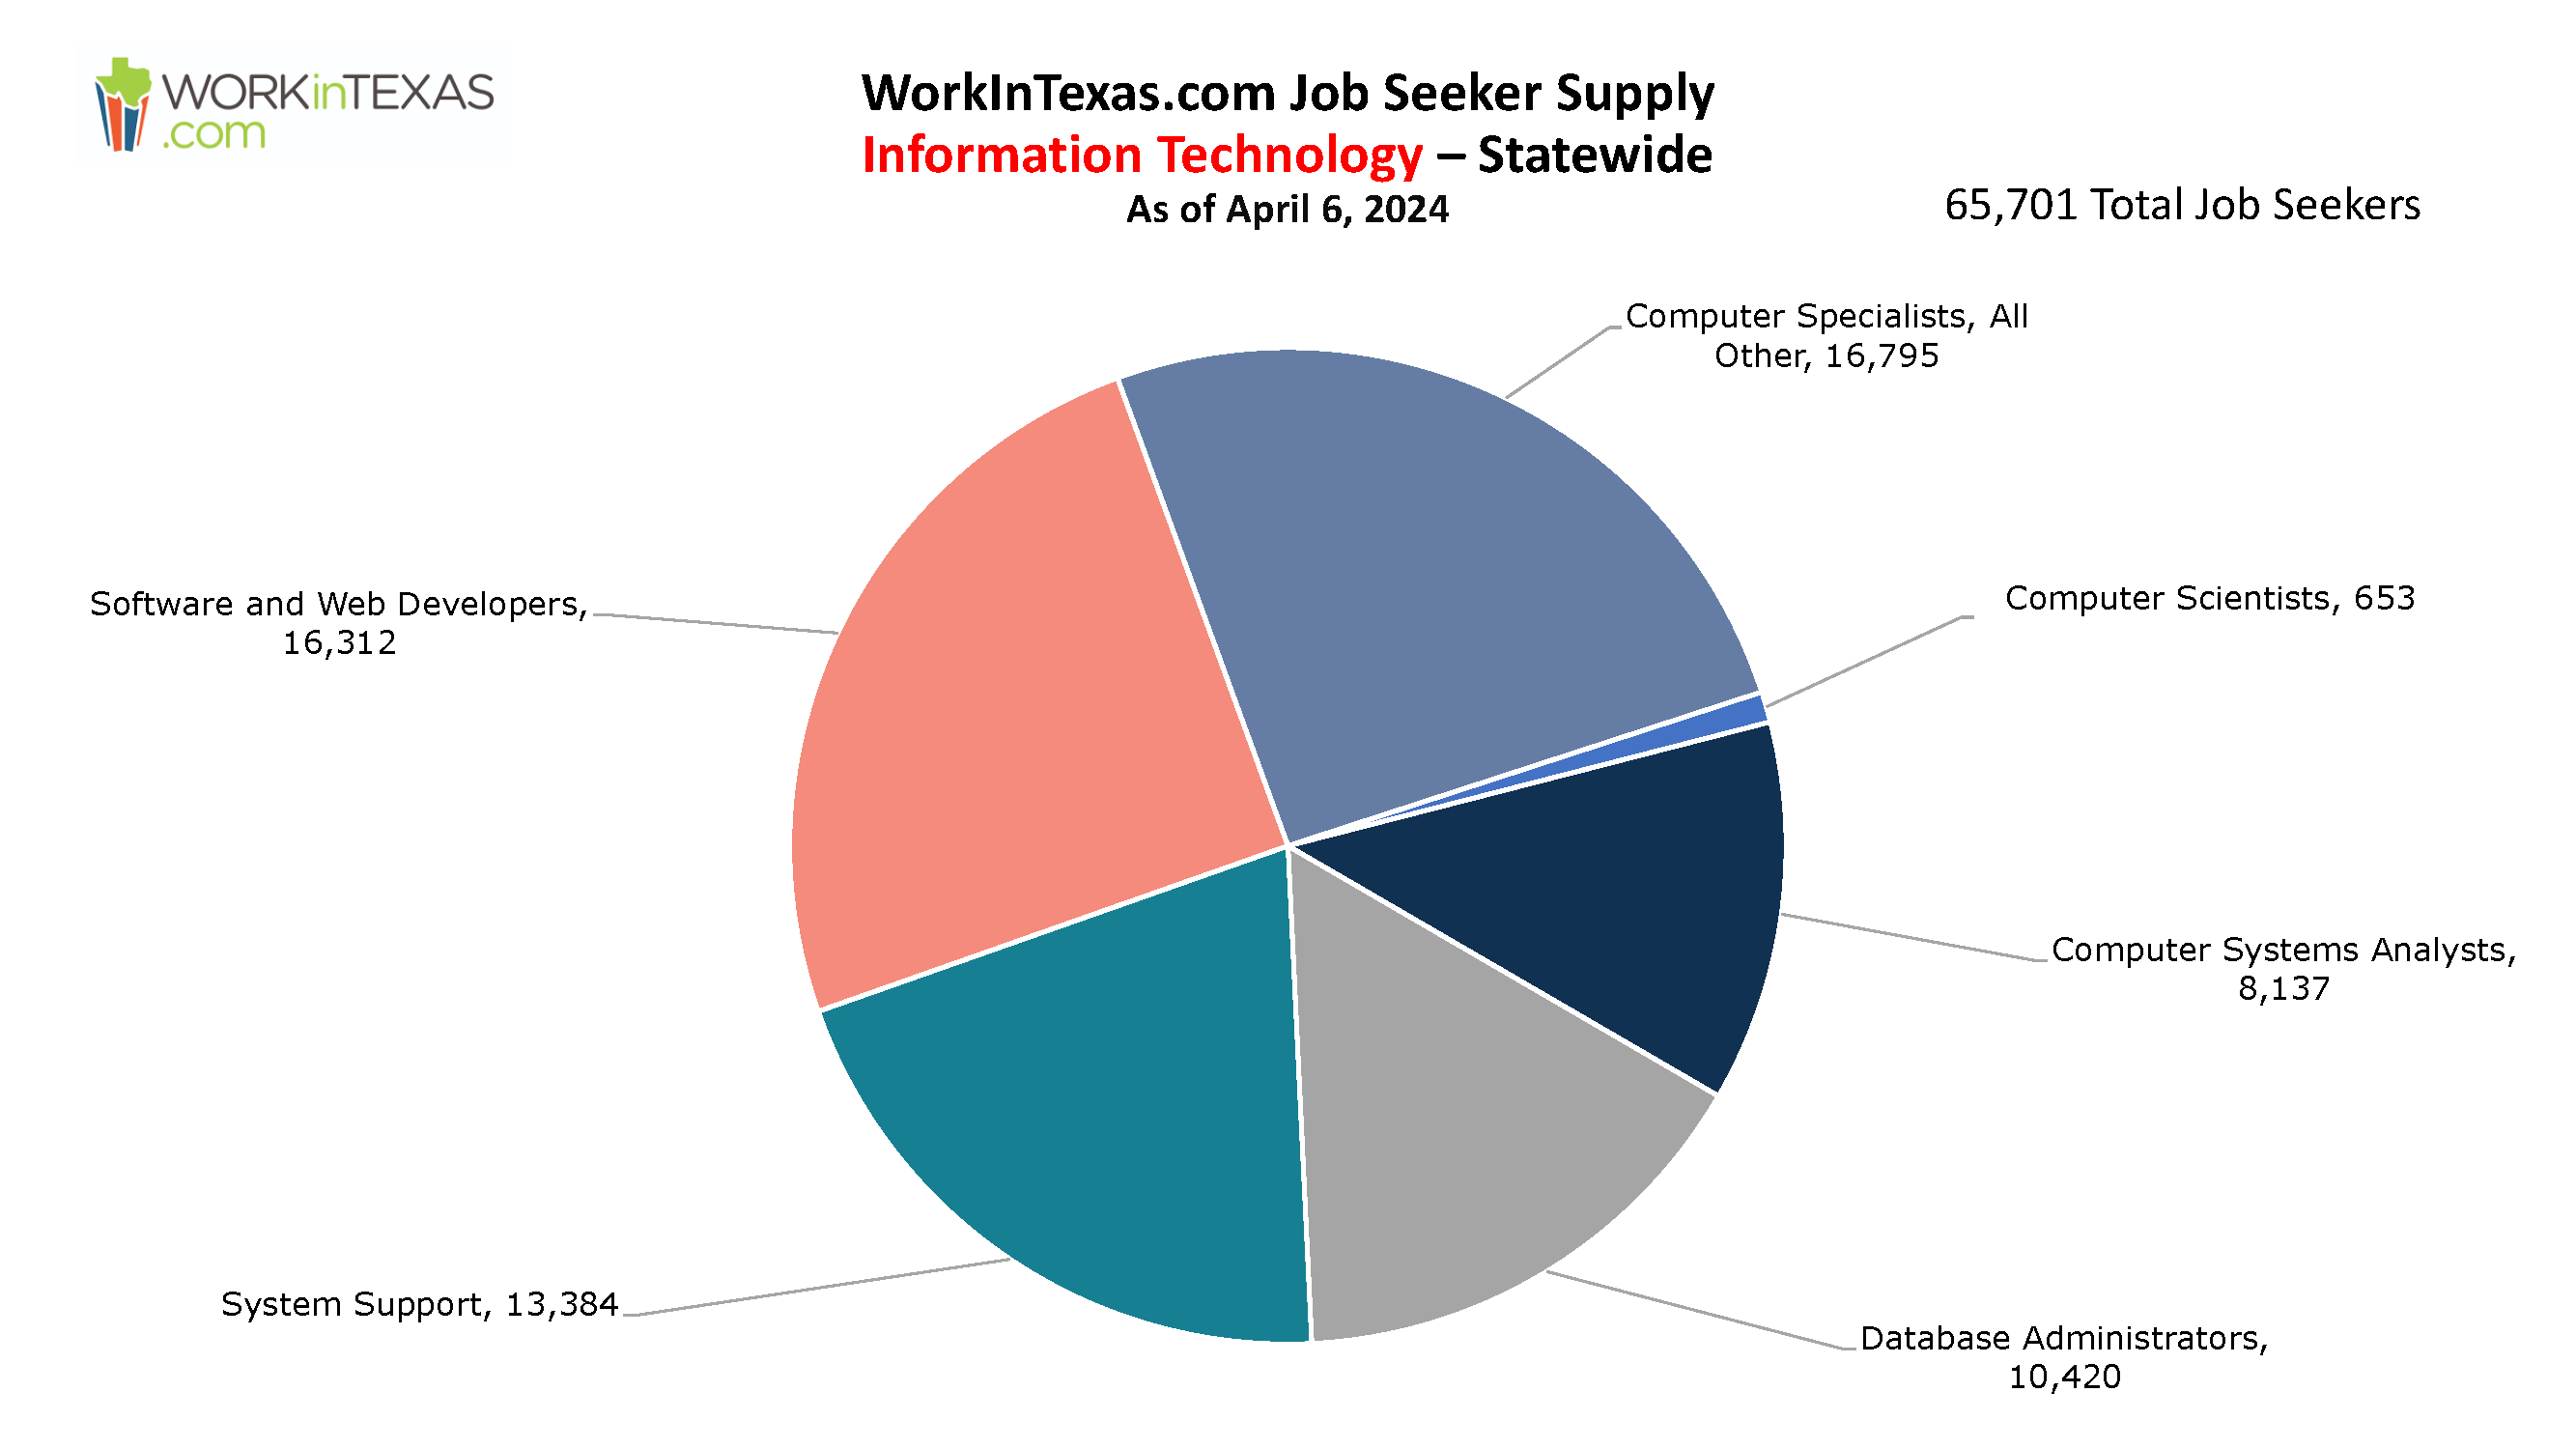
Information Technology Occupations 75,895 (Statewide)
| Occupational Category | Count |
|---|---|
| Software and Web Developers | 19,445 |
| Computer Specialists, All Other | 19,368 |
| System Support | 15,384 |
| Database Administrators | 11,541 |
| Computer Systems Analysts | 9,474 |
| Computer Scientists | 683 |
| Total | 75,895 |
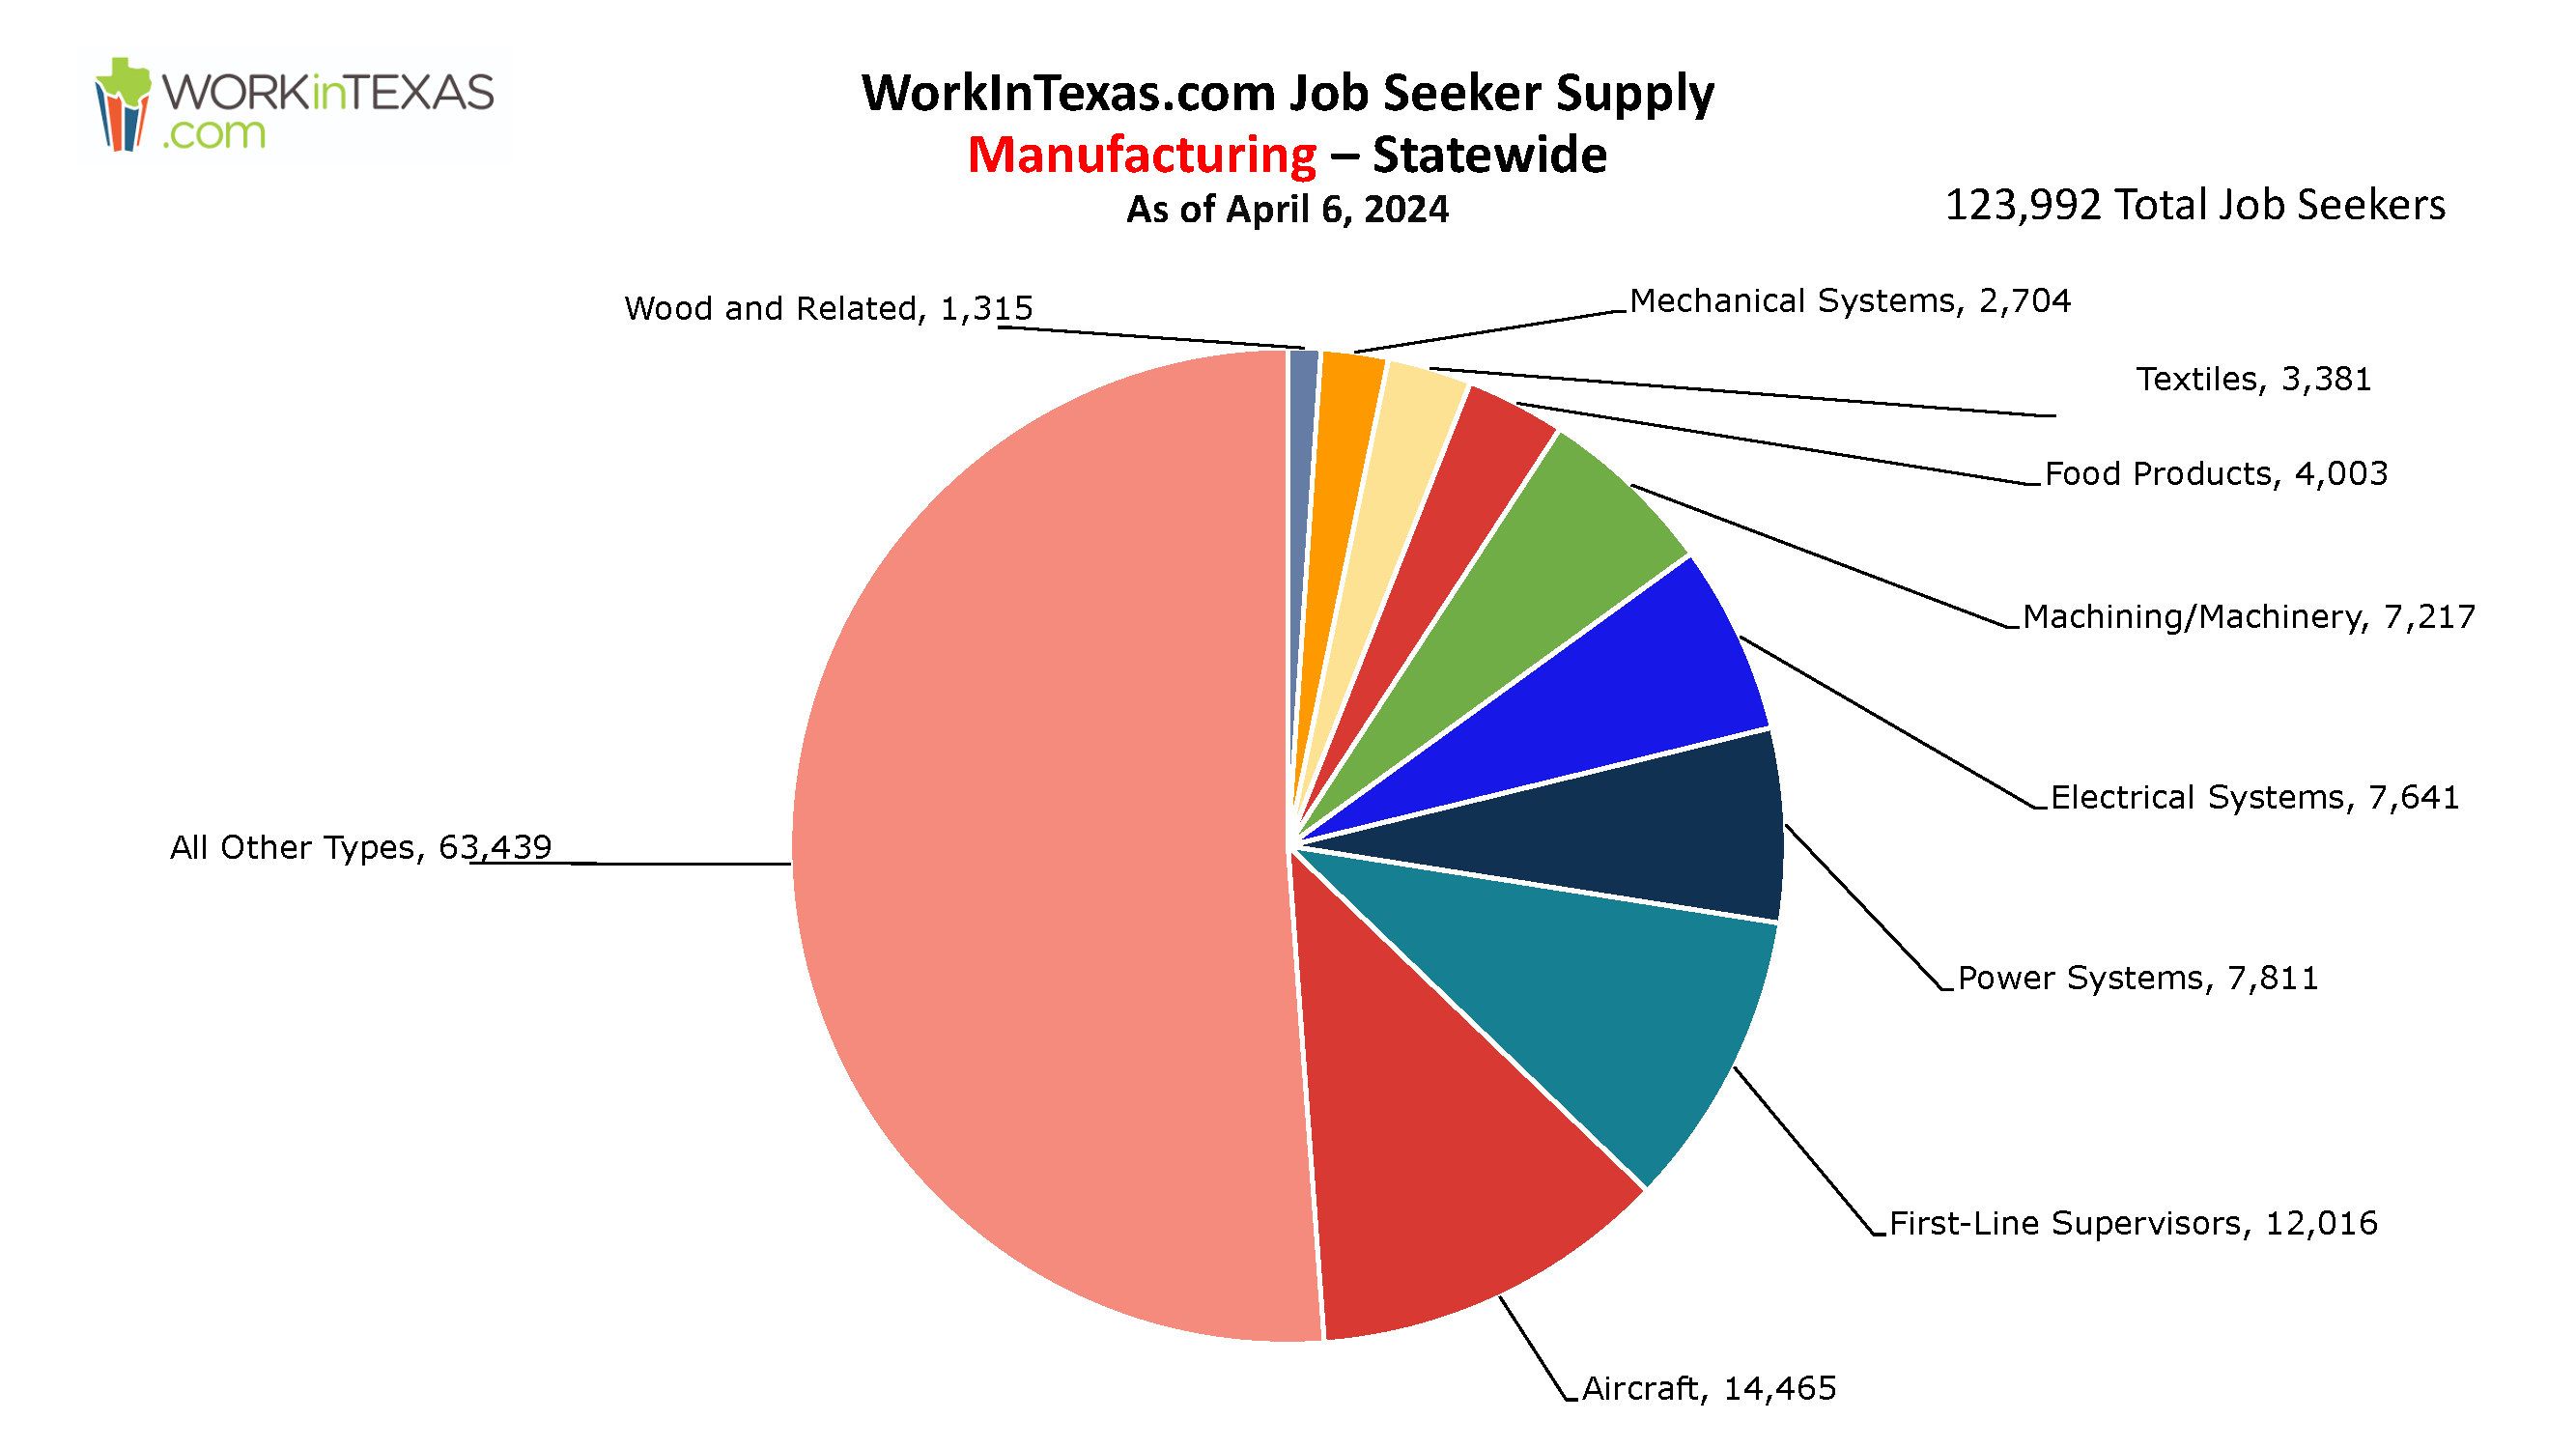
Manufacturing Occupations 133,749 (Statewide)
| Occupational Category | Count |
|---|---|
| All Other Types | 67,629 |
| Aircraft | 16,058 |
| First-Line Supervisors | 13,358 |
| Power Systems | 8,351 |
| Electrical Systems | 8,274 |
| Machining/Machinery | 7,822 |
| Food Products | 4,329 |
| Textiles | 3,602 |
| Mechanical Systems | 2,928 |
| Wood and Related | 1,398 |
| Total | 133,749 |
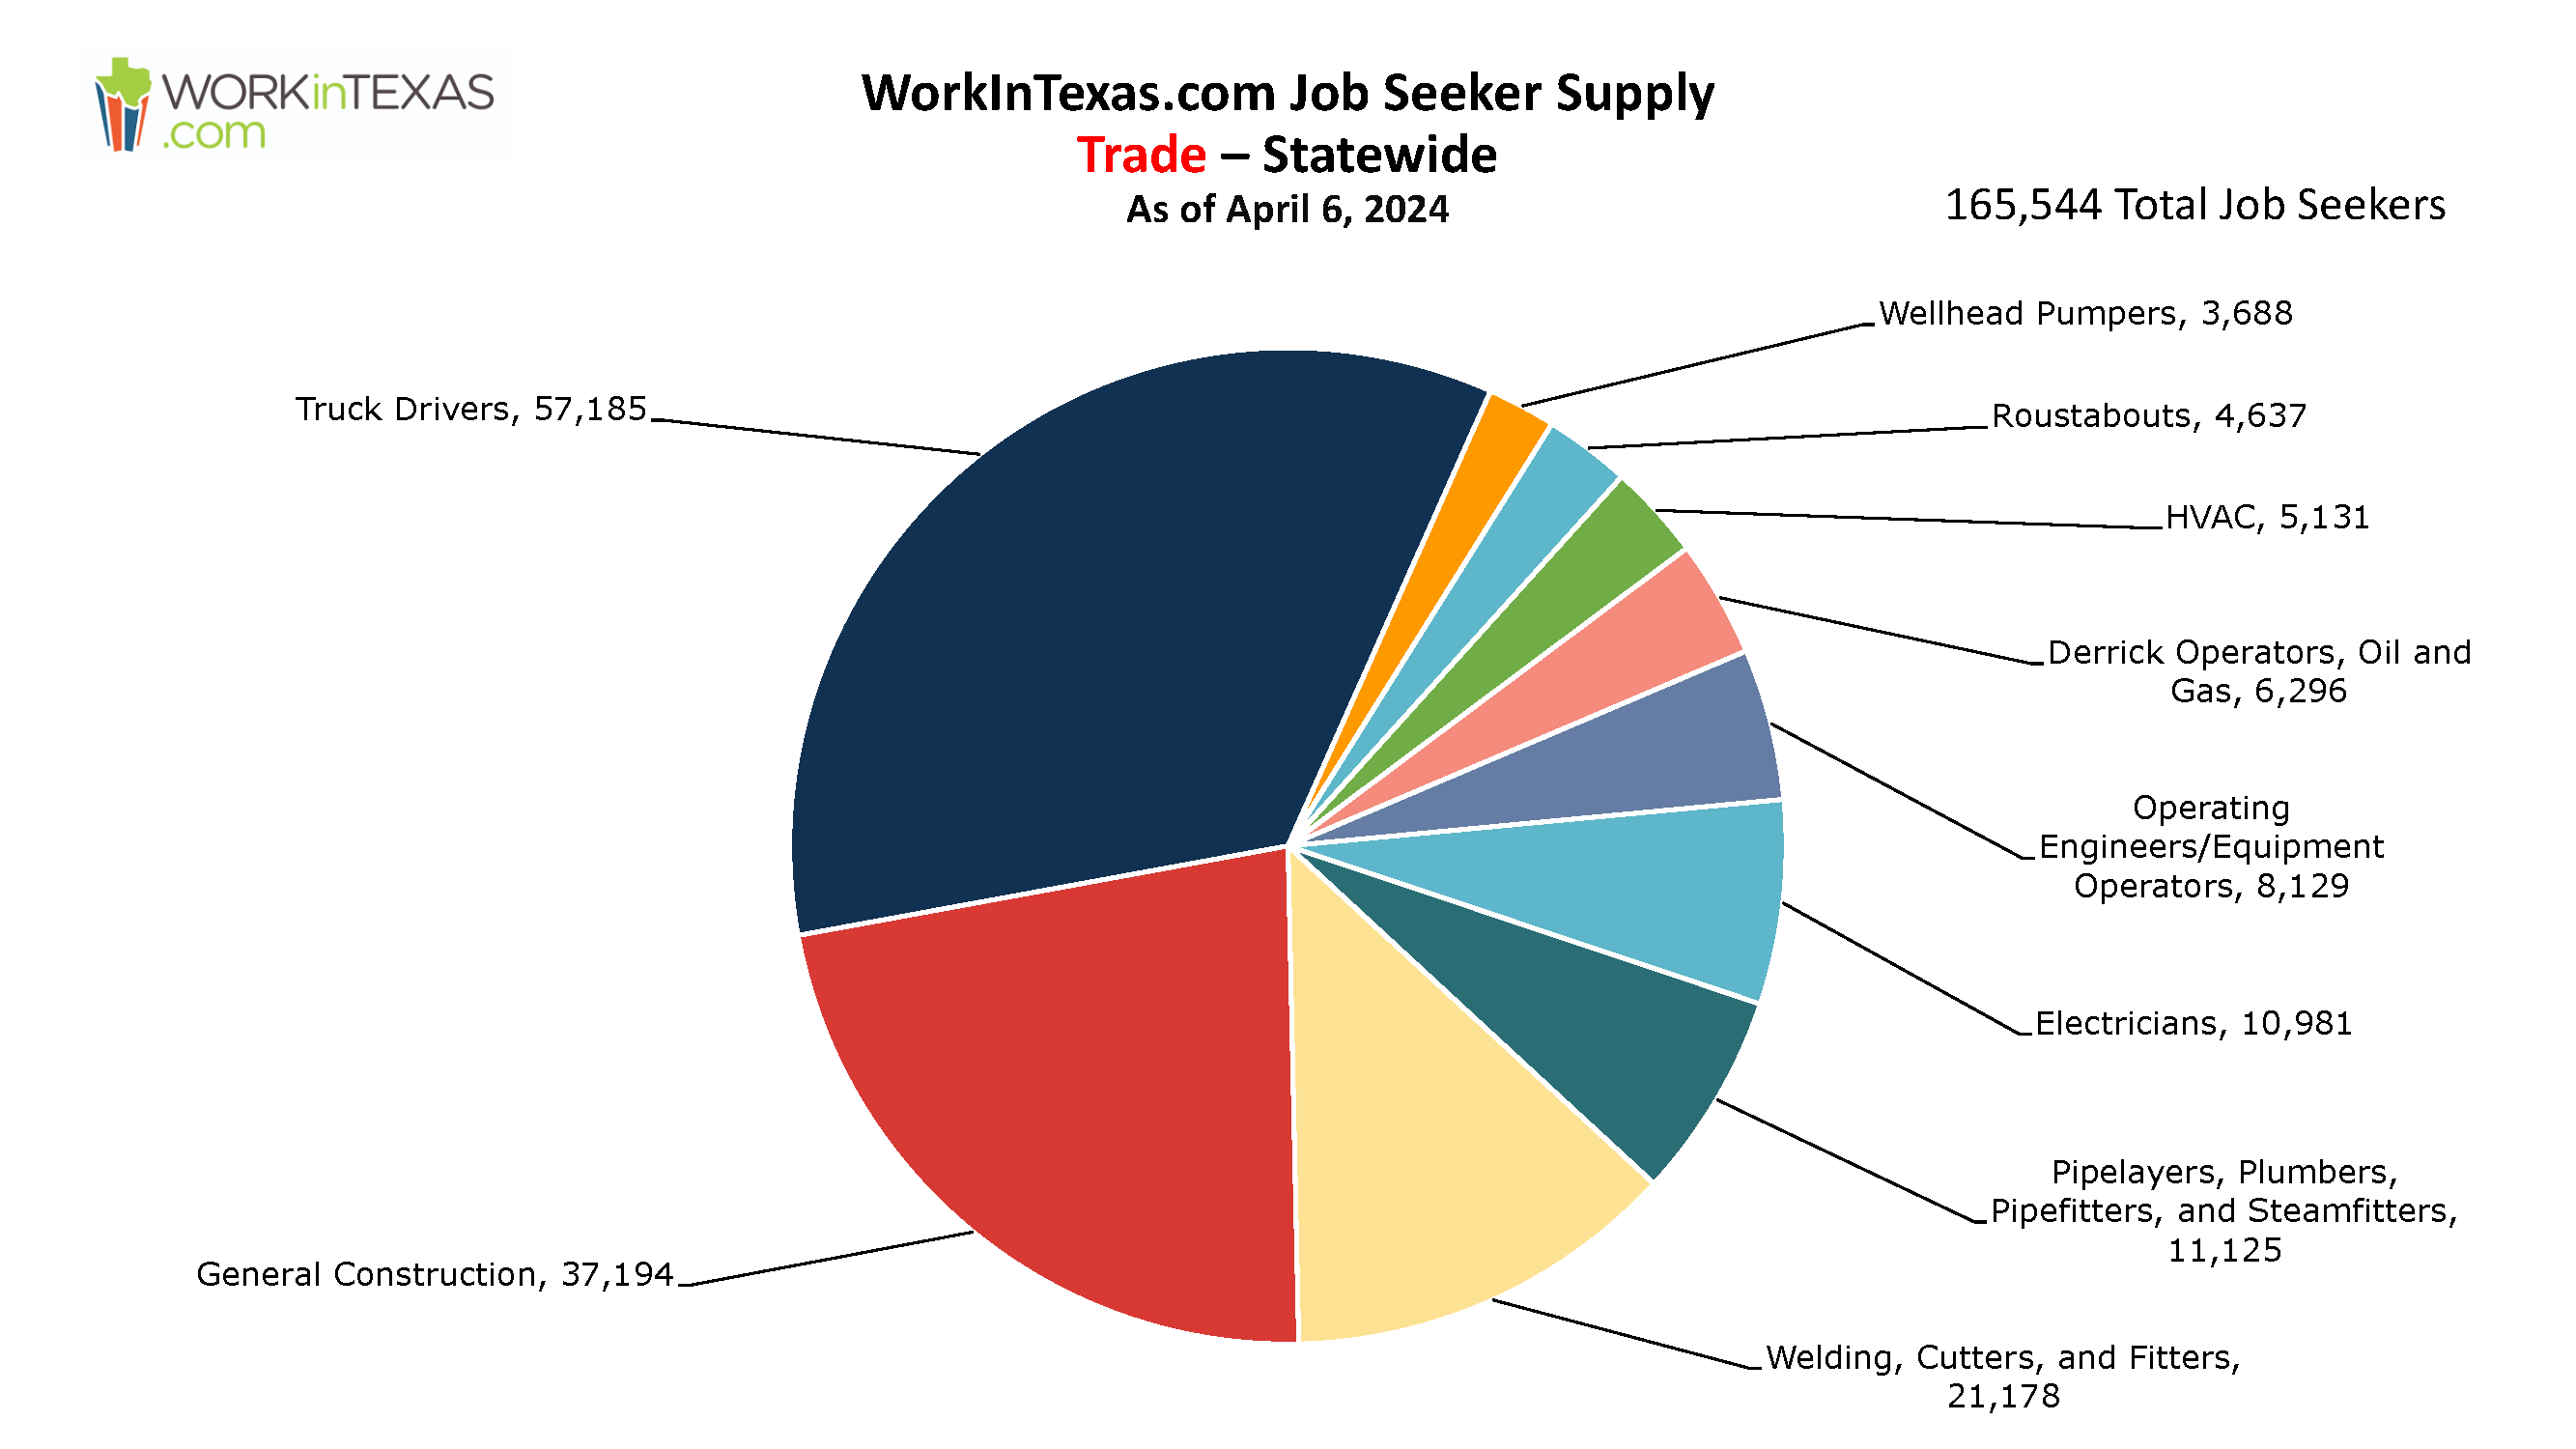
Trade Occupations 180,074 (Statewide)
| Occupational Category | Count |
|---|---|
| Truck Drivers | 63,570 |
| General Construction | 39,946 |
| Welding, Cutters, and Fitters | 22,439 |
| Electricians | 12,042 |
| Pipelayers, Plumbers, Pipefitters, and Steamfitters | 11,752 |
| Operating Engineers/Equipment Operators | 9,070 |
| Derrick Operators, Oil and Gas | 6,636 |
| HVAC | 5,720 |
| Roustabouts | 4,989 |
| Wellhead Pumpers | 3,910 |
| Total | 180,074 |